Many employers across the country, including those in Fond du Lac County, are having a hard time filling jobs. Here are four ways compensation data from Envision Greater Fond du Lac’s Economic Development team can help businesses with their talent strategy:
- Understand pay rates across your entire market
- See what specific competitors are offering
- Track wage trends over time for your roles
- Benchmark talent availability at certain wage rates
Let’s review real world examples of what this data looks like.
Understand pay rates across your entire market
By looking at the market pay rates (see chart below), you can understand how much of the available talent might be interested, or qualified, for a specific job posting. In this example, a $45,000 offer for an administrative assistant is above the median salary range, but you are only able to attract haff of the total market.
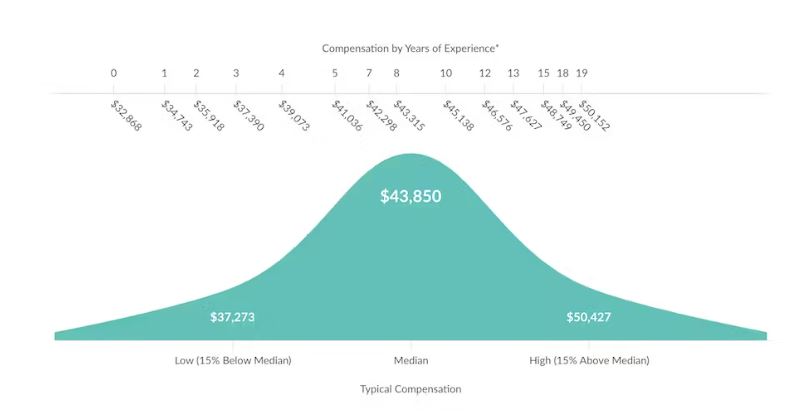
Photo Source: Lightcast
See what specific competitors are offering
Envision Greater Fond du Lac has access to powerful tools that allow our staff to see what companies are posting for specific jobs and how much they are claiming to pay perspective employees. This allows our clients to gain more insight into salary benchmarking. For example, if your company is looking for CNC operators with no educational experience beyond a high school diploma, and are looking to have a starting wage of $18/hour, you will see you are competing with five other businesses and that the median wage offered is higher than what you are offering.

Photo Source: JobsEQ RTI Report from 11/3/23
Track wage trends over time for your roles
Looking at wage data over time can help you make informed decisions about what wages to offer.
Photo Source: Lightcast Workforce Availability Report pulled May 2023 for Paint & Spray Operators
Benchmark talent availability at certain wage rates
Our data and research team helped a client identify the workforce availability for first-line supervisors in the roofing industry at a specific hourly wage within a four-county study area. The findings demonstrated the workforce availability at a specific hourly wage based on skillset.
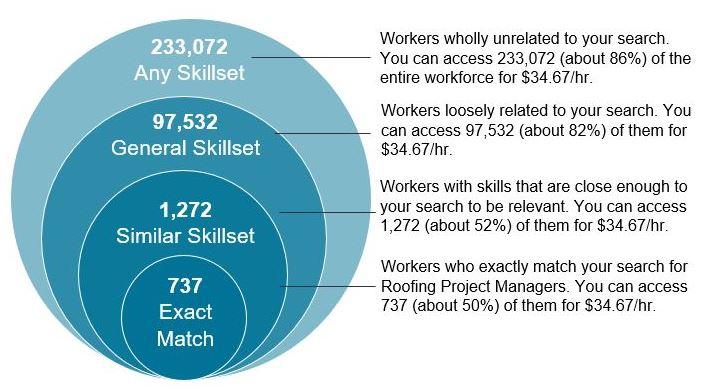
Photo Source: Lightcast data pulled 2021 for client.
If you are having difficulty filling positions and are interested in having a wage and workforce analysis conducted, reach out to our Director of Business Intelligence at [email protected] or 920.921.9500.